
Page 5 - NUTRINSIGHT-5-HD
P. 5
NutrInsight • Slow-release carbohydrates: Growing evidence on metabolic responses and public health interest
sources, the hydrolysis degree of starch granules (after 72 h of incubation with porcine pancreatic a-amylase)
ranged from only 2.5% in water yam starch to 89% in rice starch [Srichuwong et al., 2005]. This implies that the
digestibility of these starches would also differ in the human digestive tract.
These data show that, even as a raw material that has not been subjected to food processing (another
factor impacting starch digestibility, see Part 1.3), starch exhibits a wide range of digestibility profiles. These
observations have emphasized the need to develop methods for measuring starch digestibility.
A validated method for quantifying Slowly Digestible Starch in foods
In the past 30 years, several in vitro methods have been proposed by various researchers for measuring starch
or carbohydrate digestibility [Woolnough et al., 2008]. By comparing these methods regarding reliability,
validation in human clinical trials and potential for routine analysis, the analytical method developed by
Dr. Englyst called the SDS method [Englyst et al., 1996; Englyst et al., 1999] emerges.
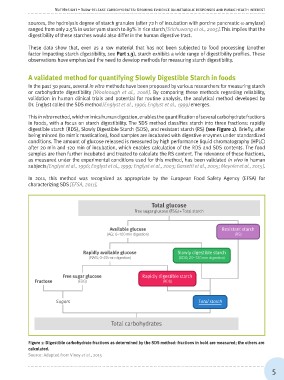
This in vitro method, which mimics human digestion, enables the quantification of several carbohydrate fractions
in foods, with a focus on starch digestibility. The SDS method classifies starch into three fractions: rapidly
digestible starch (RDS), Slowly Digestible Starch (SDS), and resistant starch (RS) (see Figure 1). Briefly, after
being minced (to mimic mastication), food samples are incubated with digestive enzymes under standardized
conditions. The amount of glucose released is measured by high performance liquid chromatography (HPLC)
after 20 min and 120 min of incubation, which enables calculation of the RDS and SDS contents. The food
samples are then further incubated and treated to calculate the RS content. The relevance of these fractions,
as measured under the experimental conditions used for this method, has been validated in vivo in human
subjects [Englyst et al., 1996; Englyst et al., 1999; Englyst et al., 2003; Garsetti et al., 2005; Meynier et al., 2015].
In 2011, this method was recognized as appropriate by the European Food Safety Agency (EFSA) for
characterizing SDS [EFSA, 2011].
Total glucose
Free sugar glucose (FSG) + Total starch
Available glucose Resistant starch
(AG; 0–120 min digestion) (RS)
Rapidly available glucose Slowly digestible starch
(RAG; 0–20 min digestion) (SDS; 20–120 min digestion)
Fructose Free sugar glucose Rapidly digestible starch
(FSG) (RDS)
Sugars Total starch
Total carbohydrates
Figure 1: Digestible carbohydrate fractions as determined by the SDS method: fractions in bold are measured; the others are
calculated.
Source: Adapted from Vinoy et al., 2015
5