
Page 11 - NUTRINSIGHT-5-HD
P. 11
NutrInsight • Slow-release carbohydrates: Growing evidence on metabolic responses and public health interest
2.2 An isotopic labeling approach for tracking the metabolic
fate of ingested carbohydrates
The blood glucose concentration results from the difference between incoming glucose flow i.e. glucose
appearance from exogenous dietary carbohydrates and endogenous glucose production (EGP) and outgoing
glucose flow i.e. glucose disappearance by tissue uptake. Therefore, a moderate postprandial glucose response
may indicate either a slow appearance of ingested carbohydrates or a rapid tissue
uptake [Péronnet et al., 2015; Schenk et al., 2003]. Thus, the commonly measured
glycemic and insulinemic responses only partially reflect the absorption
kinetics of carbohydrate-derived glucose and it is necessary to measure
glucose kinetics (glucose appearance and disappearance rates) to draw
accurate conclusions on this point.
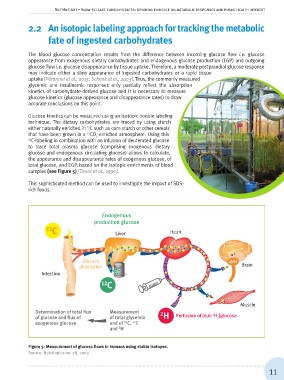
Glucose kinetics can be measured using an isotopic double labeling
technique. The dietary carbohydrates are traced by using starch
either naturally enriched in 13C such as corn starch or other cereals
that have been grown in a 13CO2-enriched atmosphere. Using this
13C-labeling in combination with an infusion of deuterated glucose
to trace total plasma glucose (comprising exogenous dietary
glucose and endogenous circulating glucose) allows to calculate,
the appearance and disappearance rates of exogenous glucose, of
total glucose, and EGP, based on the isotopic enrichments of blood
samples (see Figure 5) [Tissot et al., 1990].
This sophisticated method can be used to investigate the impact of SDS-
rich foods.
Endogenous
production glucose
13C Liver Heart
Glucose Brain
absorption
Intestine
12C
Determination of total flux Measurement Muscle
of glucose and flux of of total glycemia
exogenous glucose and of 13C, 12C H2 Perfusion of [6,6-2H2]glucose
and 2H
Figure 5: Measurement of glucose flows in humans using stable isotopes.
Source: Nutritopics no. 28, 2003
11