
Page 13 - NUTRINSIGHT-5-HD
P. 13
NutrInsight • Slow-release carbohydrates: Growing evidence on metabolic responses and public health interest
Slow release of glucose into the blood reduces the glycemic response:
mechanisms involved
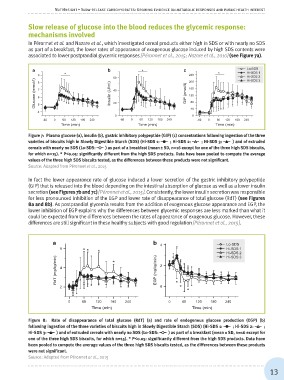
In Péronnet et al. and Nazare et al., which investigated cereal products either high in SDS or with nearly no SDS
as part of a breakfast, the lower rates of appearance of exogenous glucose induced by high SDS contents were
associated to lower postprandial glycemic responses [Péronnet et al., 2015; Nazare et al., 2010] (see Figure 7a).
* Lo-SDS
9 * 60 240 * Hi-SDS 1
8 200 Hi-SDS 2
7Glucose (mmol/l)0 60 120 180 240 160
6 Insulin (U/ml) 120 Hi-SDS 3
5 GIP (pmol/l)Time (min)
4 40 80
40
-60 20
0
0 0 60 120 180 240 -60 0 60 120 180 240
-60
Time (min) Time (min)
Figure 7: Plasma glucose (a), insulin (b), gastric inhibitory polypeptide (GIP) (c) concentrations following ingestion of the three
varieties of biscuits high in Slowly Digestible Starch (SDS) (Hi-SDS 1: ; Hi-SDS 2: ; Hi-SDS 3: ) and of extruded
cereals with nearly no SDS (Lo-SDS: ) as part of a breakfast (mean ± SD, n=16 except for one of the three high SDS biscuits,
for which n=15). * P<0.05: significantly different from the high SDS products. Data have been pooled to compute the average
values of the three high SDS biscuits tested, as the differences between these products were not significant.
Source: Adapted from Péronnet et al., 2015
In fact the lower appearance rate of glucose induced a lower secretion of the gastric inhibitory polypeptide
(GIP) that is released into the blood depending on the intestinal absorption of glucose as well as a lower insulin
secretion (see Figures 7b and 7c) [Péronnet et al., 2015]. Consistently, the lower insulin secretion was responsible
for less pronounced inhibition of the EGP and lower rate of disappearance of total glucose (RdT) (see Figures
8a and 8b). As postprandial glycemia results from the addition of exogenous glucose appearance and EGP, the
lower inhibition of EGP explains why the differences between glycemic responses are less marked than what it
could be expected from the differences between the rates of appearance of exogenous glucose. However, these
differences are still significant in these healthy subjects with good regulation [Péronnet et al., 2015].
a b4 Lo-SDS
6 ** *
* 2 Hi-SDS 1
Hi-SDS 2
4 Hi-SDS 3
RdT (mg/kg/min)
EGP (mg/kg/min)
*
2 0 **
0 60 120 180 240 0 60 120 180 240
Time (min) Time (min)
Figure 8: Rate of disappearance of total glucose (RdT) (a) and rate of endogenous glucose production (EGP) (b)
following ingestion of the three varieties of biscuits high in Slowly Digestible Starch (SDS) (Hi-SDS 1: ; Hi-SDS 2: ;
Hi-SDS 3: ) and of extruded cereals with nearly no SDS (Lo-SDS: ) as part of a breakfast (mean ± SD, n=16 except for
one of the three high SDS biscuits, for which n=15). * P<0.05: significantly different from the high SDS products. Data have
been pooled to compute the average values of the three high SDS biscuits tested, as the differences between these products
were not significant.
Source: Adapted from Péronnet et al., 2015
13