
Page 15 - NUTRINSIGHT-5-HD
P. 15
NutrInsight • Slow-release carbohydrates: Growing evidence on metabolic responses and public health interest
2.4 Promising beneficial health effects of SDS
Several studies have investigated the impact of SDS content on other health parameters.
A high SDS content can potentially improve insulin sensitivity
at the subsequent meal
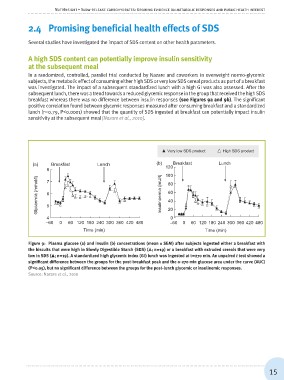
In a randomized, controlled, parallel trial conducted by Nazare and coworkers in overweight normo-glycemic
subjects, the metabolic effect of consuming either high SDS or very low SDS cereal products as part of a breakfast
was investigated. The impact of a subsequent standardized lunch with a high GI was also assessed. After the
subsequent lunch, there was a trend towards a reduced glycemic response in the group that received the high SDS
breakfast whereas there was no difference between insulin responses (see Figures 9a and 9b). The significant
positive correlation found between glycemic responses measured after consuming breakfast and a standardized
lunch (r=0.79, P<0.0001) showed that the quantity of SDS ingested at breakfast can potentially impact insulin
sensitivity at the subsequent meal [Nazare et al., 2010].
Very low SDS product High SDS product
(a) Breakfast Lunch (b) Breakfast Lunch
8 120
Glycaemia (mmol/l) 100
Insulinaemia (mU/l)
7 80
6 60
40
5 20
4 0
–60 0 60 120 180 240 300 360 420 480 –60 0 60 120 180 240 300 360 420 480
Time (min) Time (min)
Figure 9: Plasma glucose (a) and insulin (b) concentrations (mean ± SEM) after subjects ingested either a breakfast with
the biscuits that were high in Slowly Digestible Starch (SDS) ( ; n=19) or a breakfast with extruded cereals that were very
low in SDS ( ; n=19). A standardized high glycemic index (GI) lunch was ingested at t=270 min. An unpaired t test showed a
significant difference between the groups for the post-breakfast peak and the 0-270 min glucose area under the curve (AUC)
(P<0.05), but no significant difference between the groups for the post-lunch glycemic or insulinemic responses.
Source: Nazare et al., 2010
15