
Page 21 - NUTRINSIGHT-5-HD
P. 21
NutrInsight • Slow-release carbohydrates: Growing evidence on metabolic responses and public health interest
Plasma Glucose Concentration (mg/dl) 200 CGI (n=48)
180
160 IGT
(n=64)
140 NGT IFG (n=24)
(n=101)
120
100
80 30 60 90 120
0 Time (min)
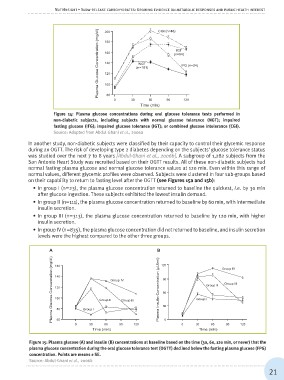
Figure 14: Plasma glucose concentrations during oral glucose tolerance tests performed in
non-diabetic subjects, including subjects with normal glucose tolerance (NGT); impaired
fasting glucose (IFG); impaired glucose tolerance (IGT); or combined glucose intolerance (CGI).
Source: Adapted from Abdul-Ghani et al., 2006a
In another study, non-diabetic subjects were classified by their capacity to control their glycemic response
during an OGTT. The risk of developing type 2 diabetes depending on the subjects’ glucose tolerance status
was studied over the next 7 to 8 years [Abdul-Ghani et al., 2006b]. A subgroup of 1,282 subjects from the
San Antonio Heart Study was recruited based on their OGTT results. All of these non-diabetic subjects had
normal fasting plasma glucose and normal glucose tolerance values at 120 min. Even within this range of
normal values, different glycemic profiles were observed. Subjects were clustered in four sub-groups based
on their capability to return to fasting level after the OGTT (see Figures 15a and 15b):
• In group I (n=23), the plasma glucose concentration returned to baseline the quickest, i.e. by 30 min
after glucose ingestion. These subjects exhibited the lowest insulin demand.
• In group II (n=111), the plasma glucose concentration returned to baseline by 60 min, with intermediate
insulin secretion.
• In group III (n=313), the plasma glucose concentration returned to baseline by 120 min, with higher
insulin secretion.
• In group IV (n=835), the plasma glucose concentration did not returned to baseline, and insulin secretion
levels were the highest compared to the other three groups.
AB
160Plasma Glucose Concentration (mg/dl) 120 Group IV
Plasma Insulin Concentration (µU/ml) 90 Group II Group III
140 60 Group I
Group IV 30
120
100 Group II Group III
80 Group I
60 0
0 30 60 90 120 0 30 60 90 120
Time (min) Time (min)
Figure 15: Plasma glucose (A) and insulin (B) concentrations at baseline based on the time (30, 60, 120 min, or never) that the
plasma glucose concentration during the oral glucose tolerance test (OGTT) declined below the fasting plasma glucose (FPG)
concentration. Points are means ± SE.
Source: Abdul-Ghani et al., 2006b
21